Your deposit base has a maturity schedule. It is actuarial.
$124 trillion in U.S. household wealth transfers through 2048, and roughly 70 percent of inherited balances leave the incumbent institution. The Deposit Mortality Index scores your institution's exposure, using only public data: FDIC branch deposits, Census demographics, Federal Reserve holdings data, and SSA life tables.
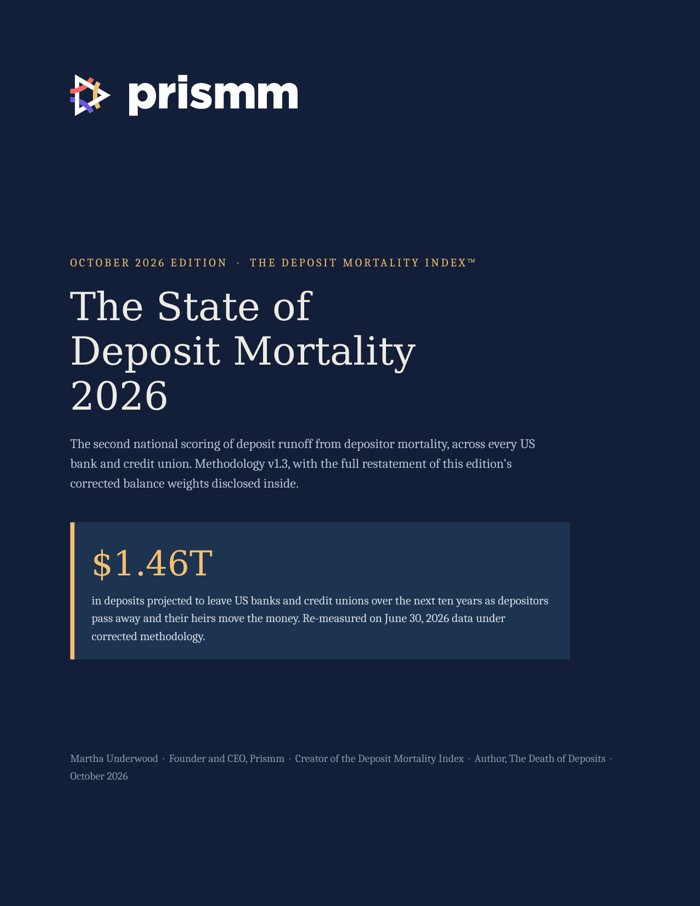
In our twelve-bank pilot cohort, estimated ten-year mortality-driven runoff ranged from 6.6 to 8.6 percent of total deposits. The difference between institutions is not whether the runoff happens. It is whether they can capture what transfers.
What is your bank's number?
Banks and credit unions score on the same index, so a 45 means the same thing at either. Enter your institution and we will build your DMI report: your composite score, your estimated ten-year runoff in dollars, how you compare against peer institutions, and the specific capabilities that would move your score.
$799 per institution report. Delivered within two business days. Prepared from public regulatory data; no data submission required.
The report, in five parts
- Your composite DMI score and tier, computed from the published methodology with your institution's actual FDIC, Census, and call report inputs.
- The growth ledger: your trailing three-year growth measured against annualized mortality runoff, including the Growth Coverage Ratio and, for credit unions, net member growth against estimated member deaths.
- Estimated ten-year mortality runoff, in percent and dollars, with the deposit-weighted age profile of your branch footprint.
- Component diagnostics: which of the four drivers (actuarial, composition, concentration, succession capacity) is doing the damage, and by how much.
- Peer comparison: your score against institutions of similar asset size and geography.
- A next-steps memo: the specific, ranked actions that would materially change your score, from beneficiary designation coverage at account origination to fiduciary capability decisions.
Built on public data. Published in full.
Deposit-weighted demographics
FDIC Summary of Deposits places every dollar of your deposits in a county. Census ACS tells us how old each county is. The join estimates the age profile of your deposit base.
Dollars, not people
Federal Reserve Survey of Consumer Finances data reweights the population by deposit holdings, because households 55 and older hold roughly 60 percent of deposit dollars.
Actuarial overlay
SSA life tables convert the dollar-weighted age mix into scheduled runoff, adjusted for spousal survivorship and the roughly 70 percent of inherited balances that leave (Cerulli).
Read the research: The State of Deposit Mortality 2026: October Edition, the current study behind the index. Companion report: The Membership Treadmill (Prismm Research, October 2026).
The complete Methodology v1.3, assumptions register, restatement note, and change log are published here: Methodology v1.3 · Overview · restatement note. For input reviews, contact [email protected].
Asked by bank executives
Is this a rating of my bank's safety and soundness?
No. The DMI is a research estimate of one specific exposure: deposit runoff attributable to depositor mortality. It is not a credit rating, an examination rating, or an assessment of your institution's condition, and a high score does not mean an institution is unsafe or unsound.
Where does the data come from? Do we have to submit anything?
Nothing. Every input is public: FDIC branch deposit data, Census demographics, Federal Reserve holdings research, SSA actuarial tables, and your quarterly call report. If you believe an input misrepresents your institution, for example a large digital or out-of-footprint deposit book, we will review and re-run it with corrected inputs at no charge.
Our depositors skew older. Is that not just every community bank?
The demographic wave is universal; the exposure is not. Institutions differ widely on footprint age, balance composition, geographic concentration, and above all on succession capture capacity. In our pilot cohort, composite scores ranged from the mid 30s to the high 60s across banks facing the same actuarial reality.
What do we do with a high score?
The report's next-steps memo ranks the interventions by impact. Some are capability decisions, such as fiduciary services. The highest-leverage one for most institutions is structural: capturing beneficiary designations at account origination, so that when transfers happen, the institution is in the transaction instead of watching it leave. That is the infrastructure Prismm builds, and we disclose that interest plainly.
Who is behind this?
The DMI is published by Prismm, the estate orchestration infrastructure company, and authored by founder Martha Underwood, a former head of retail engineering at a global institution and author of The Death of Deposits. The methodology is published in full so any analyst can reproduce or challenge it.